

A Bleaching Monitoring Network resource
Coral Reefs in a Changing Climate
Global climate change, driven primarily by anthropogenic carbon emissions, is altering the physical and chemical conditions of the oceans. Rising ocean temperatures, ocean acidification, shifting circulation patterns, and more extreme weather events are putting increasing pressure on marine ecosystems. Tropical coral reefs are particularly vulnerable as corals are highly sensitive to these anomalies.
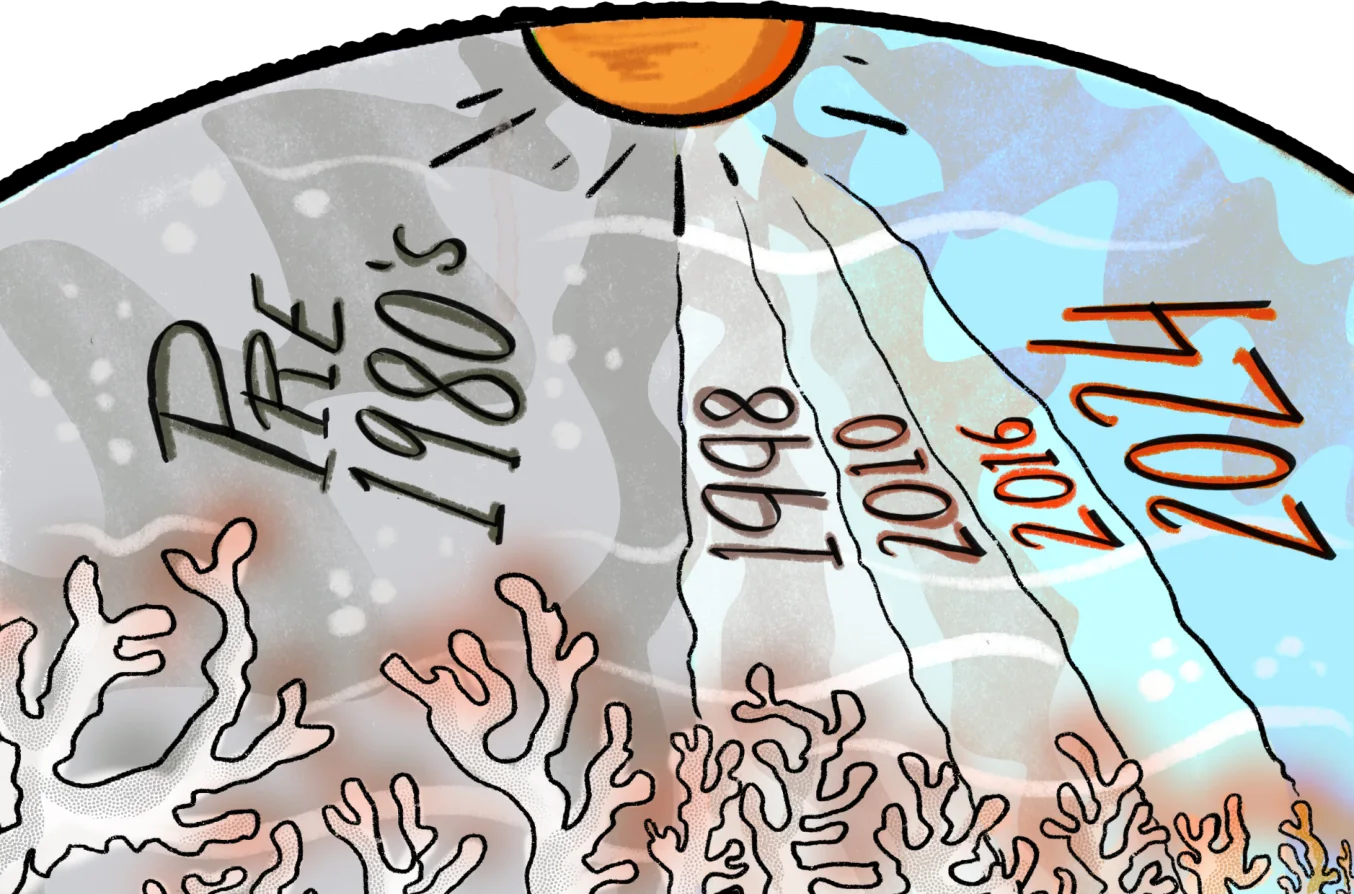
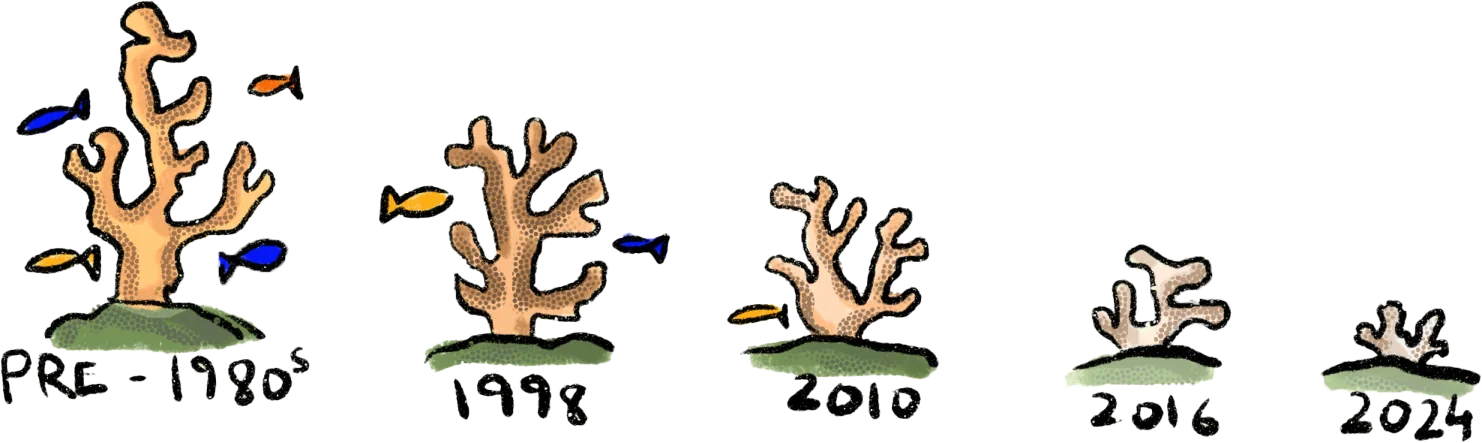
Mass coral bleaching is recognised as the most pervasive stressor on coral reefs across the world. Although bleaching can have several triggers, widespread bleaching events are commonly associated with marine heatwaves. Since the first global mass bleaching event in 1998, there have been bleaching events in 2010, 2016, and most recently in 2023-2024. The last event affected approximately 84% of the world's coral reef area through bleaching-level heat stress across at least 82 countries and territories, according to National Oceanic and Atmospheric Administration (NOAA)'s 2025 assessment.
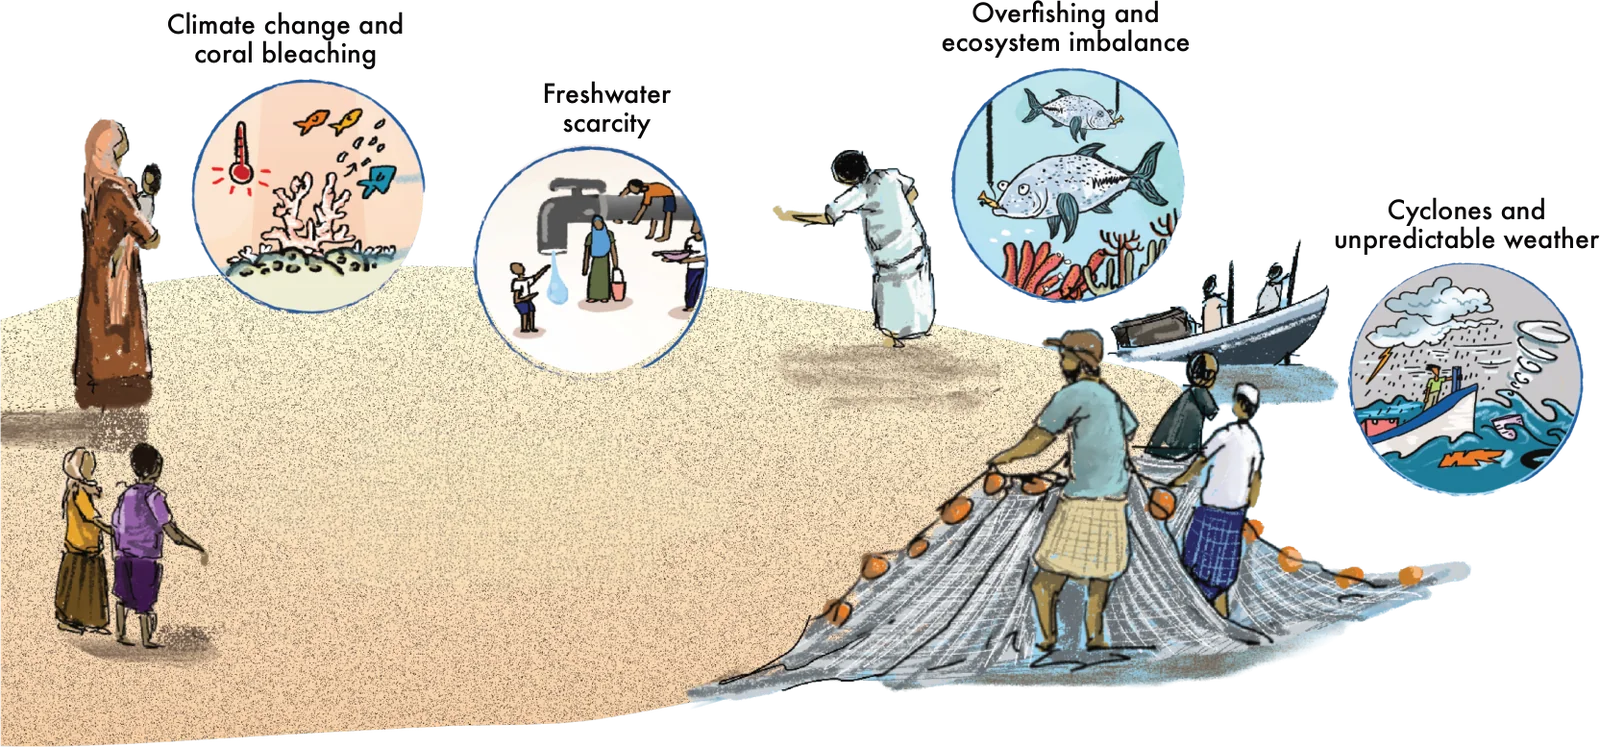
The impact of climate change on reefs is not limited to coral bleaching, but interacts with a suite of other local and regional stressors. These stressors together determine the ability of reefs to resist and recover from coral mass mortalities.
El Niño and Climate Change
El Niño, the warm phase of the El Niño–Southern Oscillation (ENSO), is a naturally occurring climate phenomenon where sea-surface temperatures in the central and eastern equatorial Pacific increase and atmospheric circulation changes.
Although distinct from anthropogenic climate change, El Niño can compound its effects on coral reefs by adding episodic warming to an ocean that is already experiencing rising temperatures. This can intensify marine heat stress and increase the risk of coral bleaching. In the Indian Ocean, El Niño further interacts in complex ways with another ocean current, the Indian Ocean Dipole, which modifies heat stress and precipitation during El Niño years.
Importantly, under the current climate change conditions, El Niño has become more intense and highly unpredictable, with the latest 2026-27 El Niño strengthening into a potential “Super El Niño” event. The prospect of recurrent marine heatwaves is particularly concerning because reefs that experienced substantial mortality following the previous event may have a small window to recover.
What is a coral?
A coral is a colony of ‘polyps’, which are marine invertebrates, closely related to jellyfish. Soft-bodied polyps build a hard calcium carbonate skeleton for protection, which results in various morphologies of corals (like branching Acropora and massive Porites). Polyps house photosynthetic, unicellular algae in their tissues, that give corals their unique colours while also providing most of their nutrition. This symbiotic relationship is extremely crucial for corals.

What are coral reefs?
Coral reefs are underwater, biogenic ecosystems built over thousands of years, through the accumulation of dead coral skeletons, along with the production of new carbonate structures by hard corals and other calcifying organisms like crustose coralline algae. These are dynamic systems held together by processes like accretion, erosion, productivity, and nutrient cycling.
Why are coral reefs important?
Coral reefs are hyperdiverse ecosystems. They provide habitats to thousands of organisms. Apart from supporting and maintaining rich biodiversity, coral reefs also provide several ecosystem goods and services to people. These include shoreline protection, harvestable biomass, tourism attractions, and basic subsistence for dependent communities.
What is coral bleaching?
Coral bleaching has emerged as the most widespread and important stress indicator globally. Spikes in ocean temperatures cause corals to expel the photosynthetic algae symbiont from their tissue, which leads them to lose their colour and turn white, i.e., bleach.
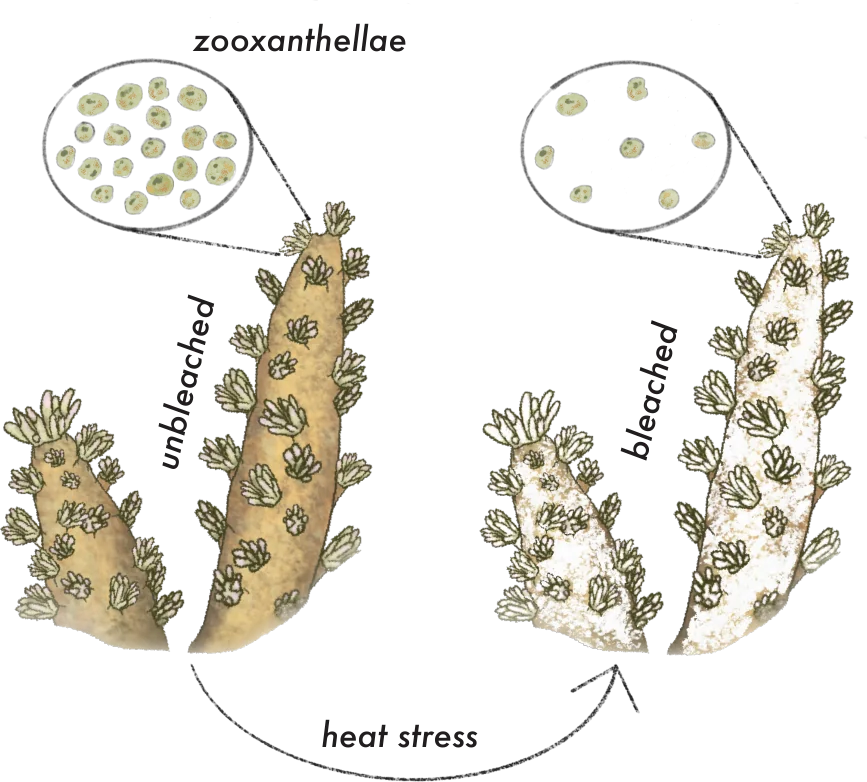
Typically, corals bleach following exposure to short-term water temperature anomalies of 1–2 °C above the usual summer maximum. Prolonged and repeated bleaching events can weaken corals and even lead to their death. However, if favourable conditions return, bleached corals can recover.
Mass coral bleaching refers to instances where large proportions of corals — across habitats, within a geographic range or across geographical ranges — bleach. This has been associated with widespread thermal disturbances, where a large body of water experiences unusually elevated sea-surface temperatures.
Threats to Coral Reefs
Coral reefs are at the forefront of climate change impacts. Warming oceans, increasingly frequent and intense cyclones, and ocean acidification are rapidly transforming coral reefs into novel configurations. Reefs also face several regional stressors, such as terrestrial inputs, overfishing of important functional groups, and unsustainable tourism loads.
Why monitor reefs?
Coral reefs are sensitive to their ambient environment, including abiotic factors that fluctuate over spatial and temporal scales. Commonly used ecological parameters describing the status of coral reefs, i.e., live coral cover, macroalgal cover and reef fish biomass, vary both within seasons and over temporal scales. Therefore, a single-point survey provides merely a snapshot of information on the status of the reef.
Following the first global mass bleaching event in 1998, there have been three more events in 2010, 2016-17, and more recently in 2024. Under current climate change projections, it is widely believed that we might be entering a new normal, where global average temperatures rise to 1.5°C above pre-industrial levels. This is a critical threshold for coral reefs, with more frequent and intense bleaching episodes predicted across the world.
As coral reef habitats transform under increasing climatic and anthropogenic disturbances, long-term monitoring programmes provide managers with necessary tools to devise site-specific and region-specific conservation measures. Monitoring through structured, repeated and replicable methodologies provides essential empirical data on the recovery potential of reefs, ecological trends within reef-associated fauna, and stressors that erode the functional capacity of coral reefs.
India-Wide Collaborative Assessments
Following the fourth global mass bleaching event in April 2024, an India-wide collaboration of researchers and citizen-scientists undertook a post-bleaching assessment of coral reefs across the country. This effort spanned Lakshadweep, Tamil Nadu (Palk Bay), the Andaman Islands, and Goa (Grande Island). This revealed variation in bleaching impacts across the regions and the important role of local identity, i.e., environmental parameters and coral composition, in mediating the effects of thermal stress. This highlighted the importance of collaborative, country-wide assessments to document and understand the impact of bleaching events across space.
With more frequent bleaching events predicted, setting up a formal network of coral reef managers, researchers, and citizen-scientists is warranted. The aim of this network is to collaborate and document the impacts of future bleaching events across all coral reef regions in India, using standardised survey protocols to generate comparable coral reef impact and recovery data.
How do scientists monitor coral reefs?
-
1Monitoring Water Temperatures
Scientists monitor water temperatures to know when corals are under high thermal stress. This helps them decide when to survey reefs underwater. Temperature monitoring can be done through satellite data or in-water loggers.
-
2Collecting Data
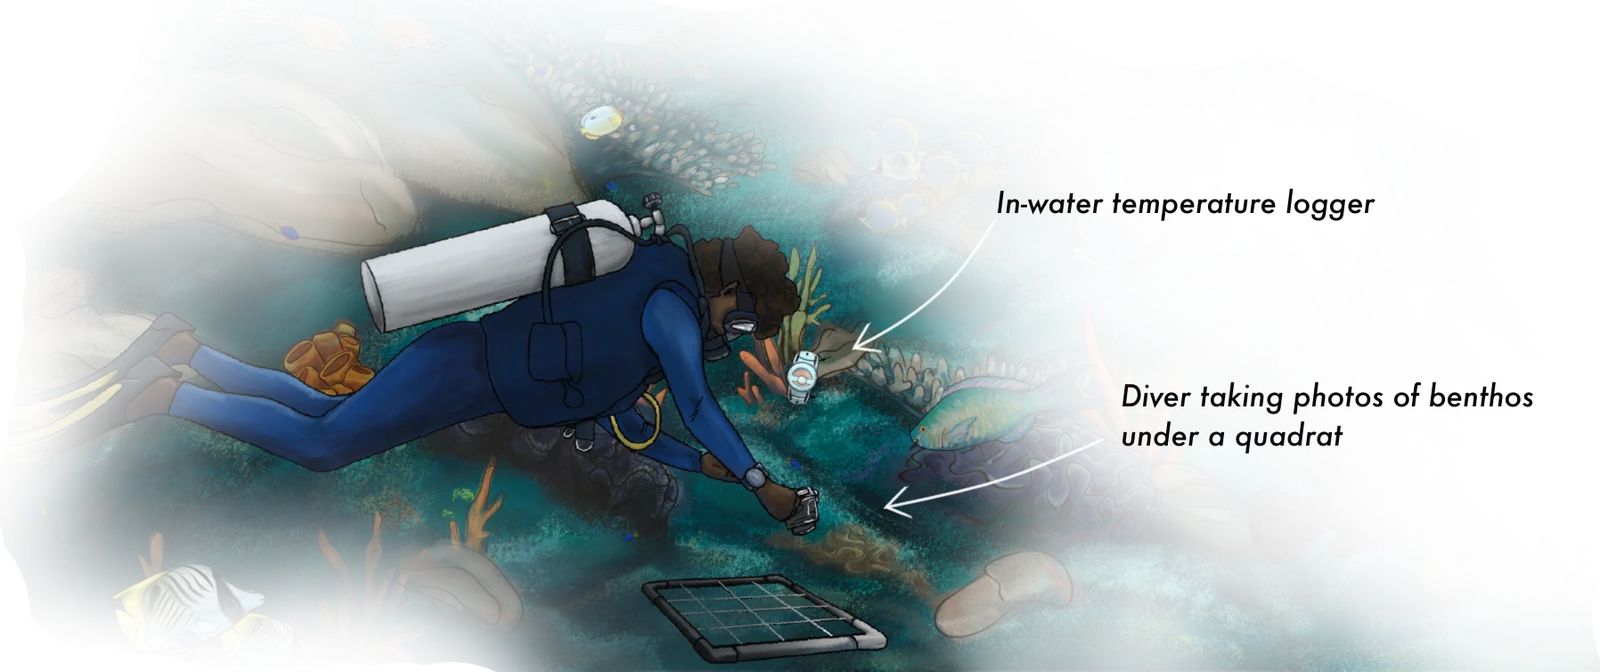
To collect data, scientists typically swim along transects, taking photos of corals under multiple quadrats. This allows them to get a representation of the benthic status of a reef.
-
3Analysing Data
The images taken underwater are analysed on a computer to note how much coral has bleached in each quadrat. Usually, this is scaled up to the reef.
-
4Visualising, Interpreting, and Communicating
The results are visualised to answer questions like how coral reefs have changed over time, and how these changes vary over space.
1Monitoring Water Temperatures
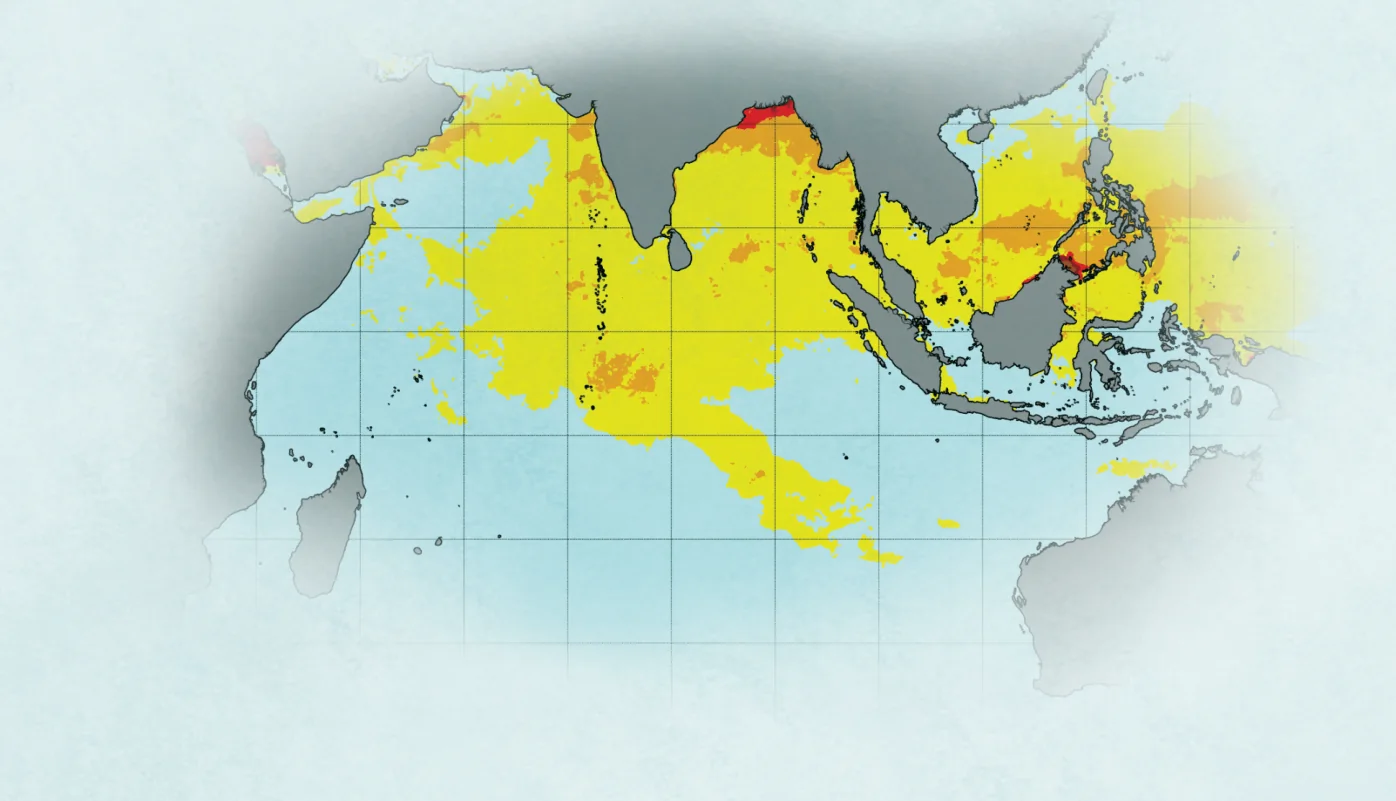
Since mass bleaching is primarily caused by heat stress during marine heatwaves, scientists continuously monitor water temperatures. This is primarily done using two methods.
Satellite Data
NOAA's website provides bleaching alerts for coral reef regions around the world. These alerts are based on a metric called degree heating weeks (DHW) which uses satellite-sensed sea surface temperature data.
In-Water Loggers
For more accurate in-water temperature measurements that better record the heat stress experienced by corals, scientists deploy in-water loggers. However, these are more expensive and require effort to deploy and retrieve to collect data.

Degree Heating Weeks (DHW)
DHW is a metric used to estimate the accumulated heat stress on coral reefs over the preceding 12 weeks. Usually, one DHW corresponds to one week of temperatures sitting 1°C above the summer peak. When DHW rise beyond 4 heating weeks, widespread bleaching is increasingly likely.
2Collecting Data
First, scientists devise a study design that helps them decide when and where to collect data, how much data to collect, and how to collect it. This process optimises the effort needed to get an accurate representation of the status of reefs.
Typically, scientists select reefs that represent the region being monitored, and take images of the benthos under 1m x 1m quadrats laid along multiple transects in each reef. The aim is to have enough images to capture the range of variation in each location.
Temporal Monitoring
Certain long-term programmes repeat this monitoring process at the same set of locations every year. This allows accurate tracking of how reefs are changing over time. During mass bleaching events, scientists may monitor reefs multiple times as the heatwave progresses. This enables comparisons of how coral genera, reefs, or entire regions, differ in their responses to varying degrees of heat stress.
Snapshot Observations
Temporal monitoring may not always be feasible. Even one-time observations can help assess the status of a reef, especially for locations that are not easily accessible. This also provides an opportunity for citizen scientists to contribute whenever possible.
3Analysing Data
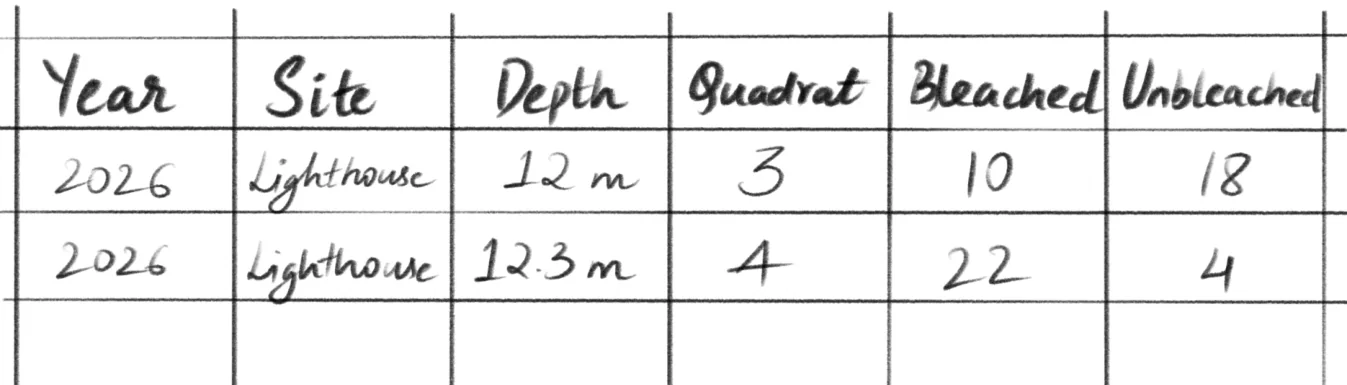
Photos of quadrats taken underwater are later annotated. When analysing images for monitoring bleaching trajectories, scientists usually note down the percentage cover of all coral genera observed in a quadrat, and what percentage of that coral cover is healthy, bleached, or dead.
This data is entered into a sheet, and is analysed to get insights into the status of reefs.
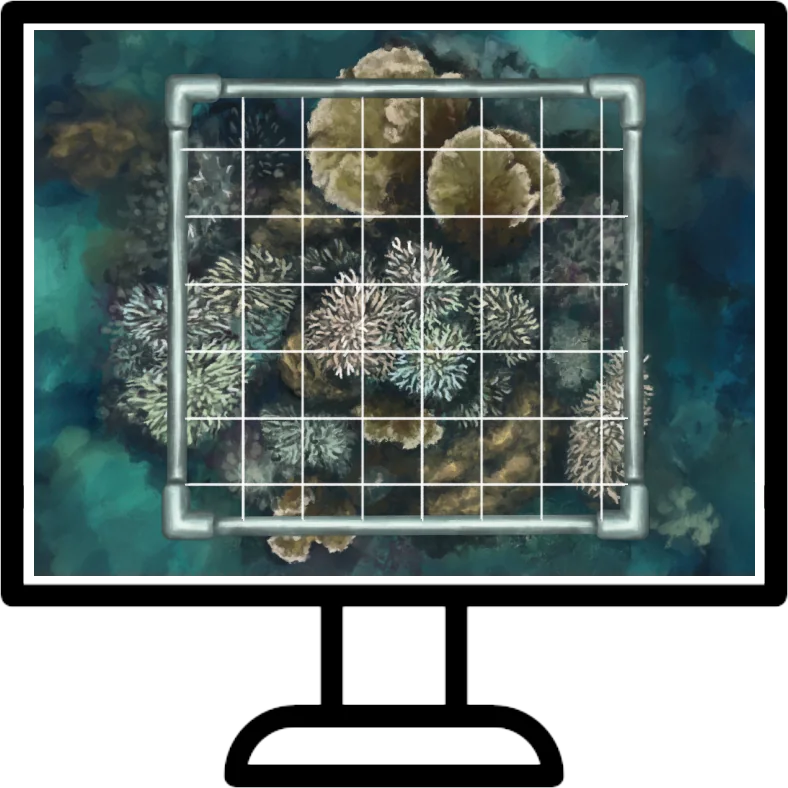
Analysing images is a time-consuming task and requires the ability to identify coral genera from images.
Two common approaches for extracting data from benthic images are (i) coral point counts - where random points are laid on the quadrat and the organism under each point is noted to get a representation of a quadrat; and (ii) a quadrat is divided into grids using image analysis programmes such as ImageJ and the percentage cover of all benthic organisms in each grid is noted.
More recently, supervised machine learning methods are also being developed to automate this process.
4Visualising, Interpreting, and Communicating Results
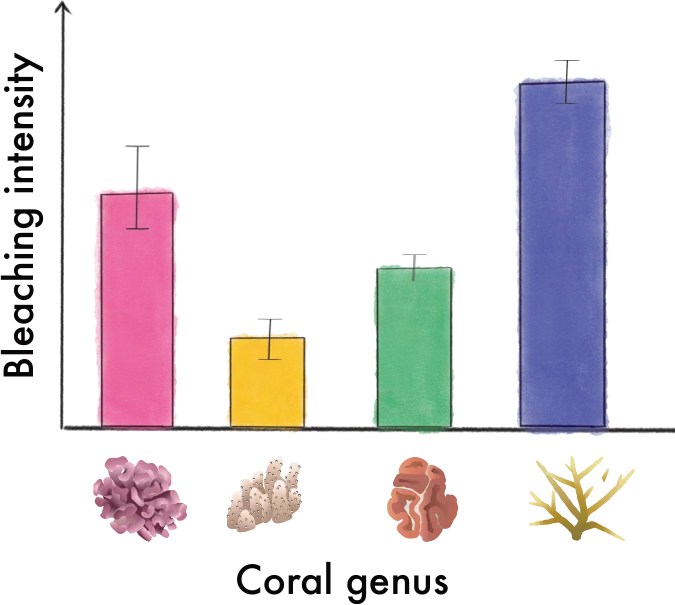
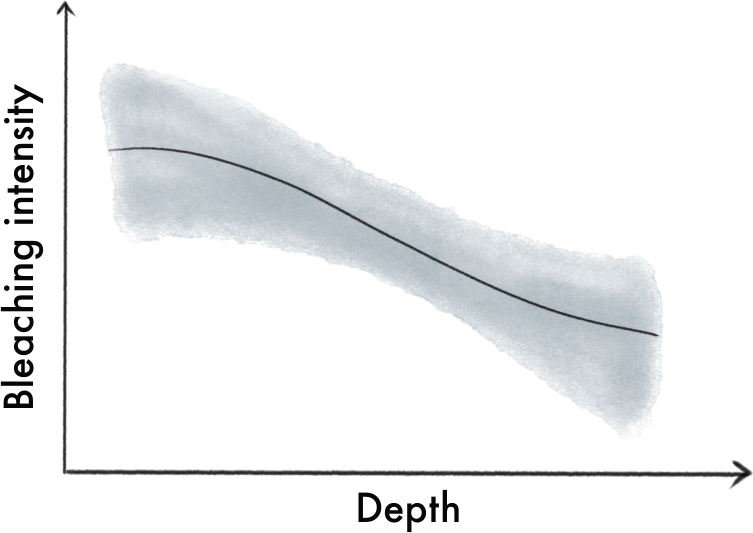
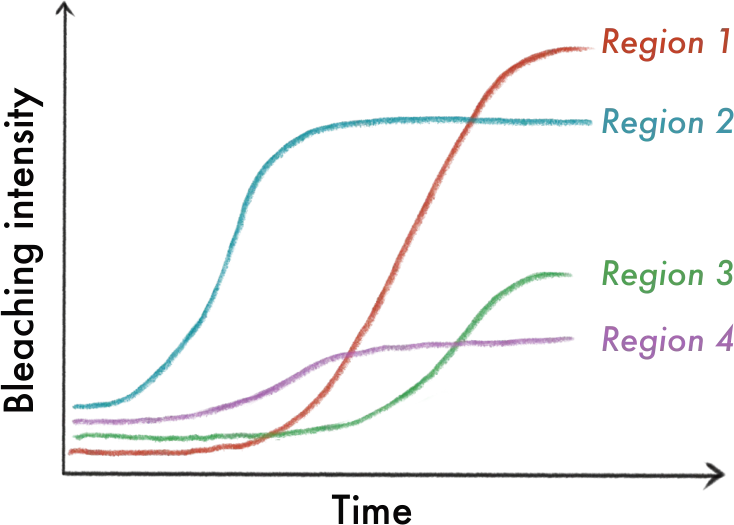
Visualisation makes results easily interpretable and communicable. How scientists visualise data depends on the questions they are trying to answer, what they are trying to communicate, and their creativity!
Good visualisation and effective communication make the results easier to use for managers.
How did our reefs respond to the 2024 global bleaching event?
In 2024, a group of scientists from 15 institutions teamed up with citizen scientists to monitor how India's reefs were affected by a mass bleaching event. They surveyed reefs across five regions in India to evaluate differences in bleaching responses. They found that regions experiencing more heat stress, generally, were more severely affected.
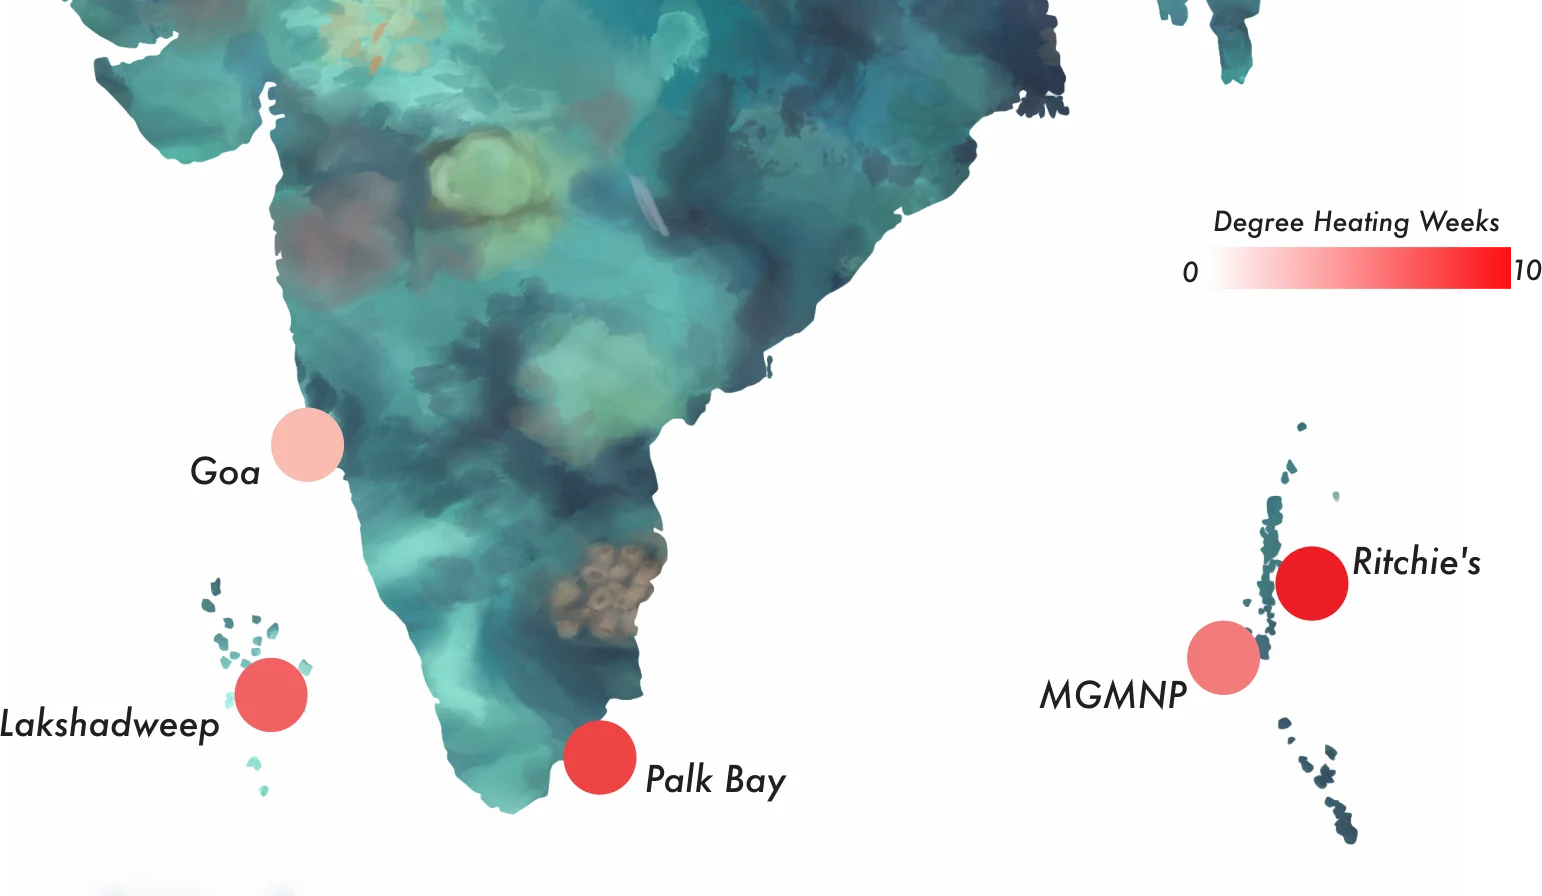
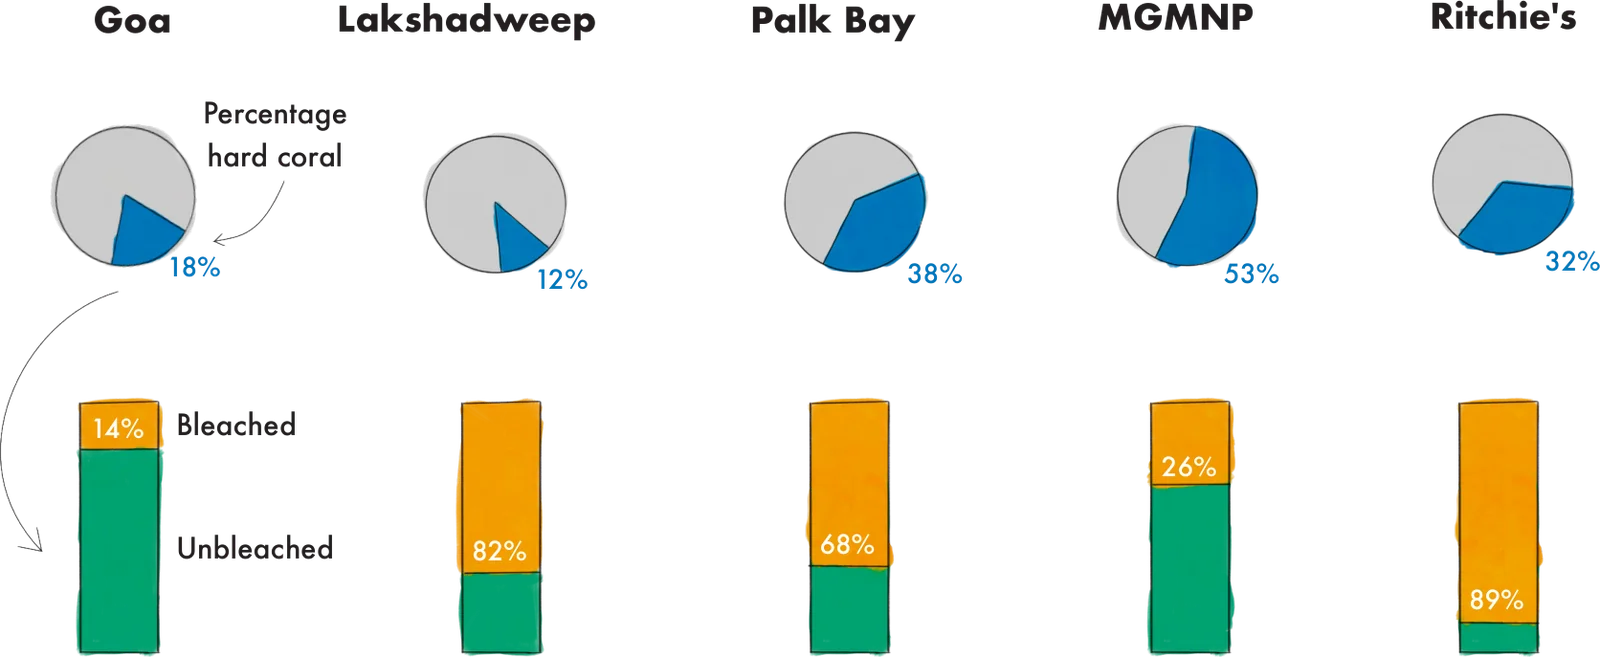
Pinto, W., Deshpande, K., Lobo, A.S. et al. Regional and genus-specific factors underpin bleaching variation across India’s coral reefs during the fourth global coral bleaching event. Coral Reefs (2026)
Managing Coral Reefs
Climate change demands a shift towards evidence-based, adaptive management that accounts for the changing nature of coral reef ecosystems. Consistent, long-term monitoring is essential to understand how reefs respond to disturbances, identify conservation priorities, and assess management effectiveness.
Management strategies must adapt to promote resistance, recovery, and long-term persistence of corals under climate change. For instance, a reef that exhibits limited bleaching despite high thermal exposure may possess intrinsic characteristics (particular coral community composition, favourable environmental conditions etc.) that promote resistance. Management can help sustain this resistance by mitigating local stressors, including pollution and sedimentation, thus reducing the possibility of an additional stressor such as coral disease. Alternatively, a reef could experience substantial bleaching, but coral populations could rapidly recover. Here, management could prioritise processes that facilitate recovery, such as protecting herbivorous fish populations and maintaining larval connectivity. In short, tailoring management strategies to each reef’s ecological characteristics and demonstrated responses is more effective than applying a one-size-fits-all approach.
In India, Marine Protected Areas (MPAs) could be strengthened by incorporating evidence of reef resistance, recovery potential, and connectivity into conservation planning. A particular priority is protecting source reefs, which supply coral larvae to surrounding reefs, and creating connected MPA networks, which can support recovery across entire reef systems. Identifying potential climate refugia—areas where reefs experience relatively lower thermal stress or retain favourable conditions—can also help safeguard reefs into the future.
However, while local management can improve the capacity of reefs to resist and recover from disturbances, sustained global reductions in carbon emissions remain essential to securing their future.
Want to contribute to monitoring our coral reefs?
Check out the detailed reef monitoring protocol!
Illustrated by Amisha Nakhwa and Malvika Tewari
Contributors
Content: Afreen Hussain, B Manikandan, Chaitanya Arjunwadkar, Harshul Thareja, Karan Deshpande, Rohan Arthur, Siddhi Jaishankar, Wenzel Pinto
Design: Harshul Thareja
Coral icons: IAN symbols via vecta.io

Supported by
